All About Thanos
Thanos is an open-source extension for Prometheus, providing long-term storage and global querying capabilities for Prometheus metrics.
Purpose of Thanos
- Global View
- Long Term Storage
- High Availability
Components of Thanos
Thanos is comprised of a set of components where each fulfills a specific role.
-
Sidecar: connects to Prometheus, reads its data for query and/or uploads it to cloud storage.
-
Store Gateway: serves metrics inside of a cloud storage bucket.
-
Compactor: compacts, downsamples and applies retention on the data stored in the cloud storage bucket.
-
Receiver: receives data from Prometheus’s remote write write-ahead log, exposes it, and/or uploads it to cloud storage.
-
Ruler/Rule: evaluates recording and alerting rules against data in Thanos for exposition and/or upload.
-
Querier/Query: implements Prometheus’s
v1API to aggregate data from the underlying components. -
Query Frontend: implements Prometheus’s
v1API to proxy it to Querier while caching the response and optionally splitting it by queries per day.
Let's see how we can transform existing prometheus setup to solve global view, high availability and long-term storage?
Step 1: Add a Thanos Sidecar
To have thanos enabled for prometheus we need to add a sidecar to our prometheus deployment.
Thanos sidecar is a small go binary that has multiple features. The main features are:
- It translates the prometheus' internal
Remote Read APIto thanos gRPC API calledStore API. - It also reloads configuration of prometheus, rules or alerts automatically from for example k8s configmap.
Step 2: Add a Stateless Thanos Querier
Thanos Querier is a thanos component that essentially performs a PromQL (prometheus native query language) evaluation on global level instead of just one prometheus.
It connects to the Store API via gRPC.
The querier exposes the same HTTP API as prometheus does, so all the Grafana dashboards and tools works because they think it is just normal prometheus.
It allows us to answer global queries, such as the number of series per cluster, by aggregating data from multiple Prometheus instances. This is possible because it has access to data from all Prometheus instances, enabling it to provide a global view of the metrics.
The Thanos Querier addresses the issue of high availability (HA) on multiple replicas of Prometheus by pulling data from both replicas, deduplicating the signals, and filling in any gaps transparently to the Querier consumer. This built-in deduplication layer enables the Querier to provide a consistent view of the data from multiple Prometheus instances, ensuring accurate and reliable query results, even in HA setups.
Step 3: Configure Long Term Storage for Metrics
For long-term storage, Thanos utilizes external storage.
Configure an object storage like S3 and provide the credentials to the Thanos sidecar.
When Prometheus generates a block in its time series database format, the sidecar takes this data block and uploads it to the specified object storage.
It's crucial to clarify that this isn't a streaming API; instead, it performs lazy upload of all the data, typically after 2 hours when Prometheus produces a complete data block.
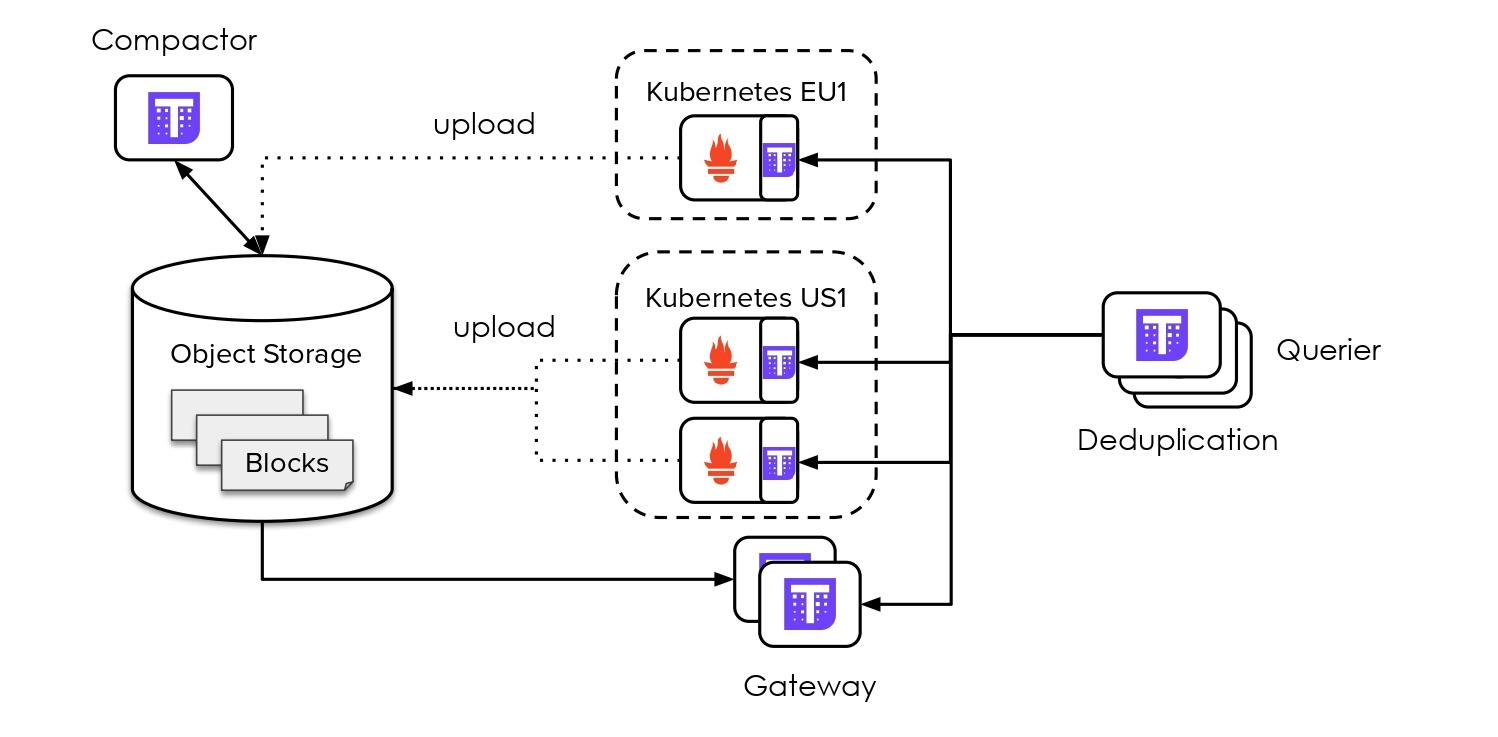
To access the data stored in the object storage, there's another component known as the store gateway. The store gateway implements the same gRPC API as the sidecar and querier. Notably, it reads data from the object storage instead of directly from the Prometheus API.
When querying recent data, the Thanos querier typically retrieves data directly from Prometheus running in the cluster via gRPC API exposed by sidecar. However, for long-term data, such as information from a year ago, it fetches the data from the object storage via gRPC API exposed by store gateway.
It's important to bear in mind that querying data from a year ago may involve a substantial number of time series, which can be slow and sometimes impractical in a regular Prometheus setup. To address this, Thanos introduces another component called the Compactor, which serves two primary functions:
- It performs downsampling.
- It consolidates multiple Prometheus tsdb blocks into fewer tsdb blocks, thereby enhancing query speed.
References: