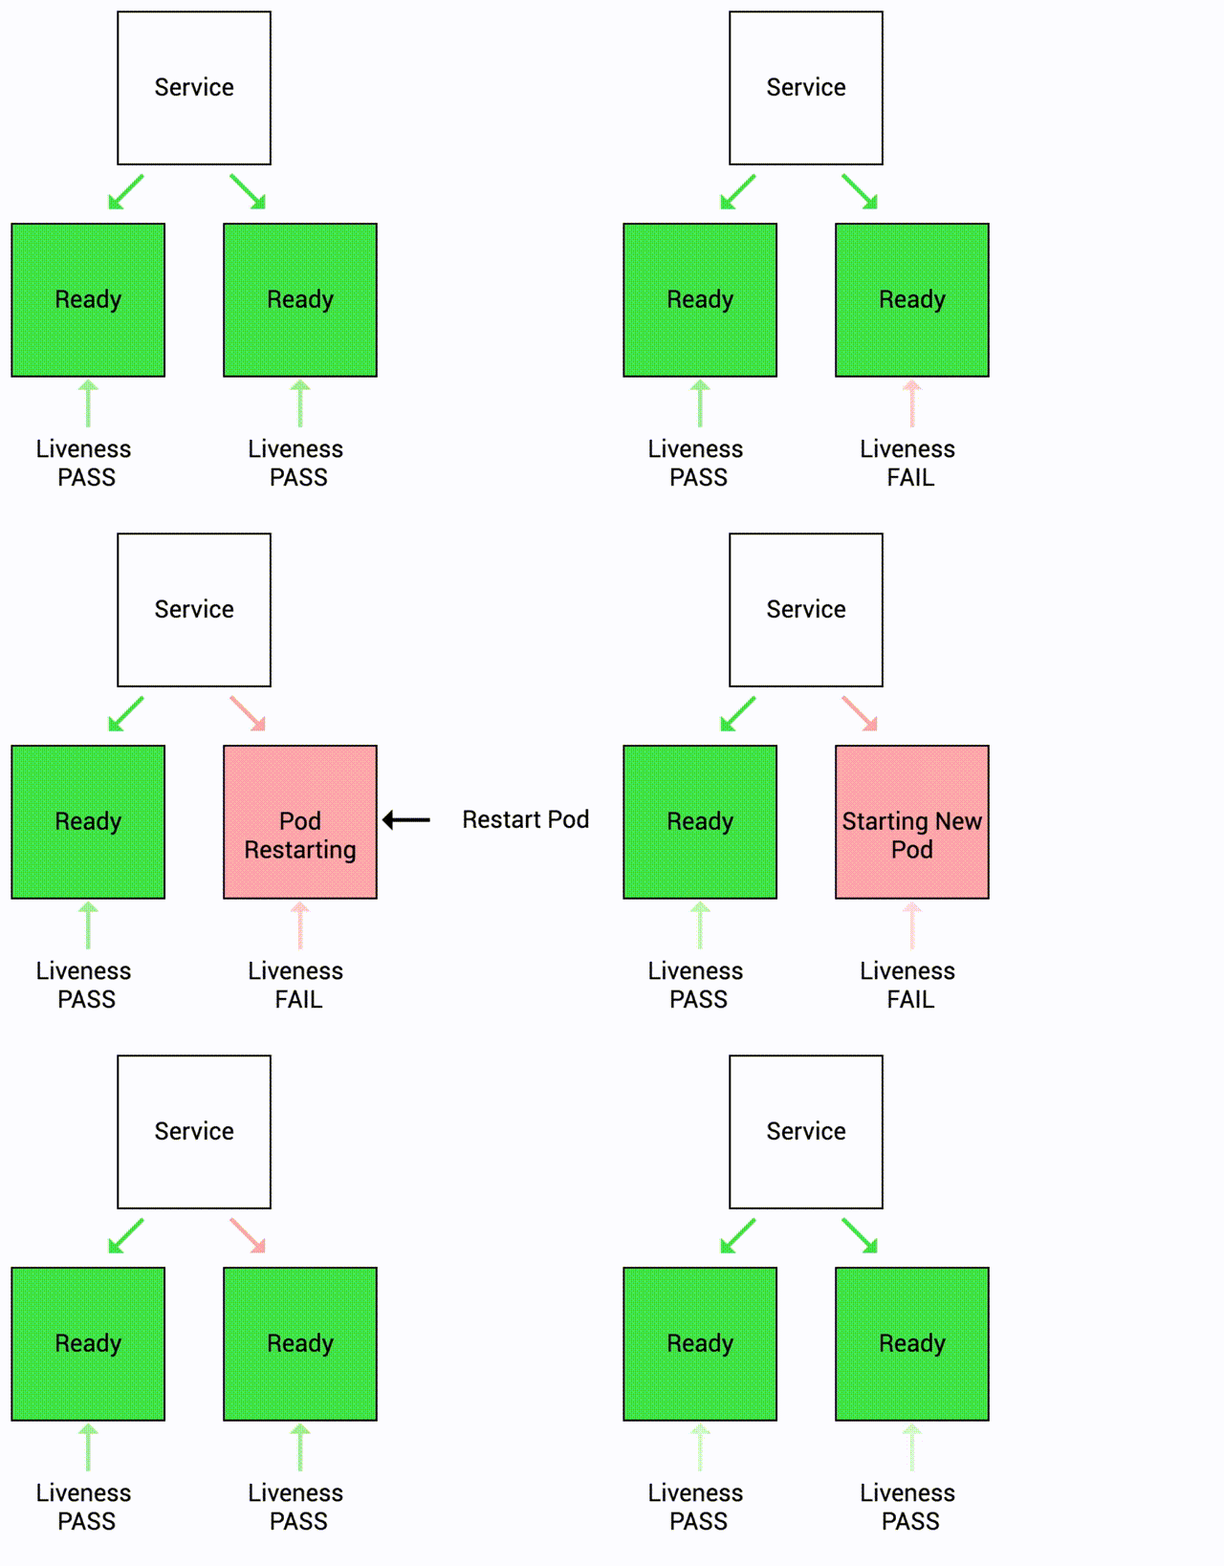
Liveness Probe Demo
Keep in mind the following:
- Liveness probe indicates whether the container is still running and responding to requests.
- The probe is performed periodically until the container is terminated or the pod is deleted.
- If liveness probe fails, container is restarted.
Let's see this in action!
Docker Image
Here is the Docker Image used in this tutorial: reyanshkharga/nodeapp
We'll be using the liveness tag of the image. reyanshkharga/nodeapp:liveness is a node.js application that has a 10% chance of failure.
Note
reyanshkharga/nodeapp:liveness is a node application with following endpoints:
GET /Returns a JSON object containingHostandVersionGET /healthReturns the health status of the application
Here's the flowchart to illustrate the working of reyanshkharga/nodeapp:liveness app:
graph LR
  A(Start) --> B{Healthy?};
  B -->|True| C{{"Generate random
  number in [1,10]"}};
  B -->|False| D(Error Response);
  C -->|Number is 9| E("Error response and
  App becomes
  unhealthy");
  C -->|Number is not 9| F(Successful Response);
Step 1: Create Deployment Without Liveness Probe
First, let's create a deployment without any liveness probe and observe the behaviour of the app:
-
Create deployment:
-
Verify deployment and pods:
Step 2: Expose Application Using a Service
Let's create a LoadBalancer service to expose our application:
-
Create service:
-
Verify service:
Step 3: Access Application
Open three seperate terminals to monitor the following:
-
Watch pods:
-
Stream logs:
-
Access application:
Hit the root endpoint again and again until you get an error. Now, when you try to access the
healthendpoint you'll see that the app is unhealthy.
Observation
Because the process continues to run, by default kubernetes thinks that everything is fine and continues to send requests to the pod even when it is unhealthy.
Step 4: Update the Deployment By Adding a Liveness Probe
Let's update the deployment by adding a liveness probe to the container.
The updated deployment should look like the following:
Fields for liveness probes:
initialDelaySeconds: Number of seconds after the container has started before liveness probe is initiated. Defaults to 0 seconds. Minimum value is 0.periodSeconds: How often (in seconds) to perform the probe. Default to 10 seconds. Minimum value is 1.timeoutSeconds: Number of seconds after which the probe times out. Defaults to 1 second. Minimum value is 1.successThreshold: Minimum consecutive successes for the probe to be considered successful after having failed. Defaults to 1. Must be 1 for liveness and startup probes because the container is restarted after the probe is failed. Minimum value is 1.failureThreshold: After a probe failsfailureThresholdtimes in a row, kubernetes considers that the overall check has failed and the container is not ready, healthy, or live.
The deployment will be rolled out.
Step 5: Access Application Again
Try to access the application again:
Hit the root endpoint again and again until you get an error. At this point the app will become unhealthy.
This time, we have a liveness probe set up. Kubernetes can detect when the application becomes unhealthy and will stop sending traffic to unhealthy pods. Kubernetes will also automatically restart the container.
You can see the events by describing the pod:
Observation
Because the liveness probe fails, the container is restarted. (check RESTARTS field)
Play with it multiple times to gain a good understanding of how liveness probe works.
Note
We currently have just a single replica in this deployment because my intention was to illustrate how a service behaves when it encounters an unhealthy pod. In a production environment, multiple pods will be available. The healthy pods will continue to handle traffic while any pods that do not pass the health probes will be taken out of the serving pool.
Clean Up
Assuming your folder structure looks like the one below:
Let's delete all the resources we created:
