Create Grafana Dashboards to Monitor Kubernetes
Now that we have Prometheus and Grafana set up properly. Let's create a few dashboards to visualize kubernetes metrics.
We will import community created dashboards.
Import Dashboards Using Script
I have written a bash script that you can use to import all the required dashboards without manual effort.
Make sure to replace the values of GRAFANA_HOST and GRAFANA_CRED variables with the values specific to your Grafana set up.
Now, run the script to import dashboards to your Grafana:
# Give execute permission to the script
chmod +x import-kubernetes-grafana-dashboards.sh

# Execute the script
./import-kubernetes-grafana-dashboards.sh
Go to grafana console to verify if the dashboards were imported successfully. Also, it would be better to move these dashboards to a seperate folder called Kubernetes.
Import Dashboards Manually
Follow the below procedures if you would like to import individual dashboards manually.
First, login to Grafana using credentials supplied during configuration. Use the username admin and get the password by running the following command:
kubectl get secret --namespace grafana grafana -o jsonpath="{.data.admin-password}" | base64 --decode ; echo
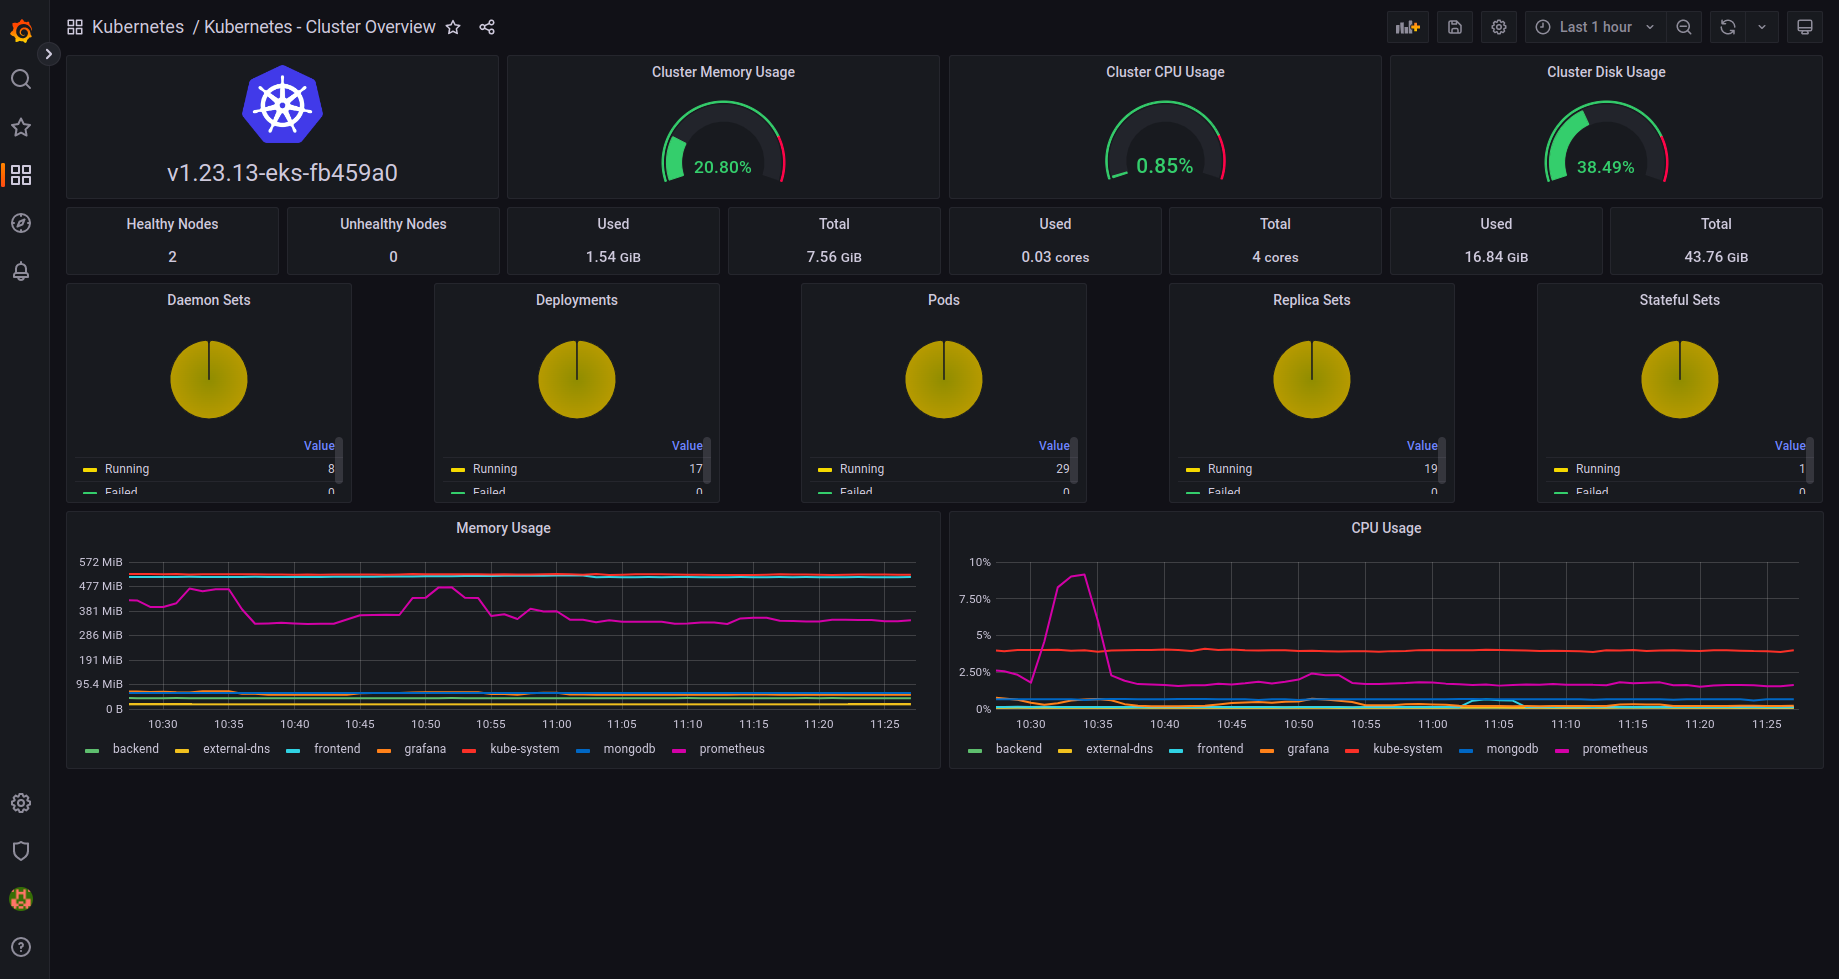
Import Kubernetes Cluster Overview Dashboard
Follow the instructions below to create a grafana dashboard to monitor the kubernetes cluster:
- Click on Dashboards on left panel and click
+ Import - Enter 17686 to import the dashboard
- Click Load
- Enter
Kubernetes - Cluster Overviewas the Dashboard name - Enter
Kubernetesas the folder name. It will create the folder if it doesn't exist. - Select
Prometheusas the endpoint under prometheus data sources drop down - Click
Import - Save the dashboard by clicking the
Save dashboardicon on the top right corner
This will dispaly an overview of the kubernetes cluster. The dashboard should look something like this:
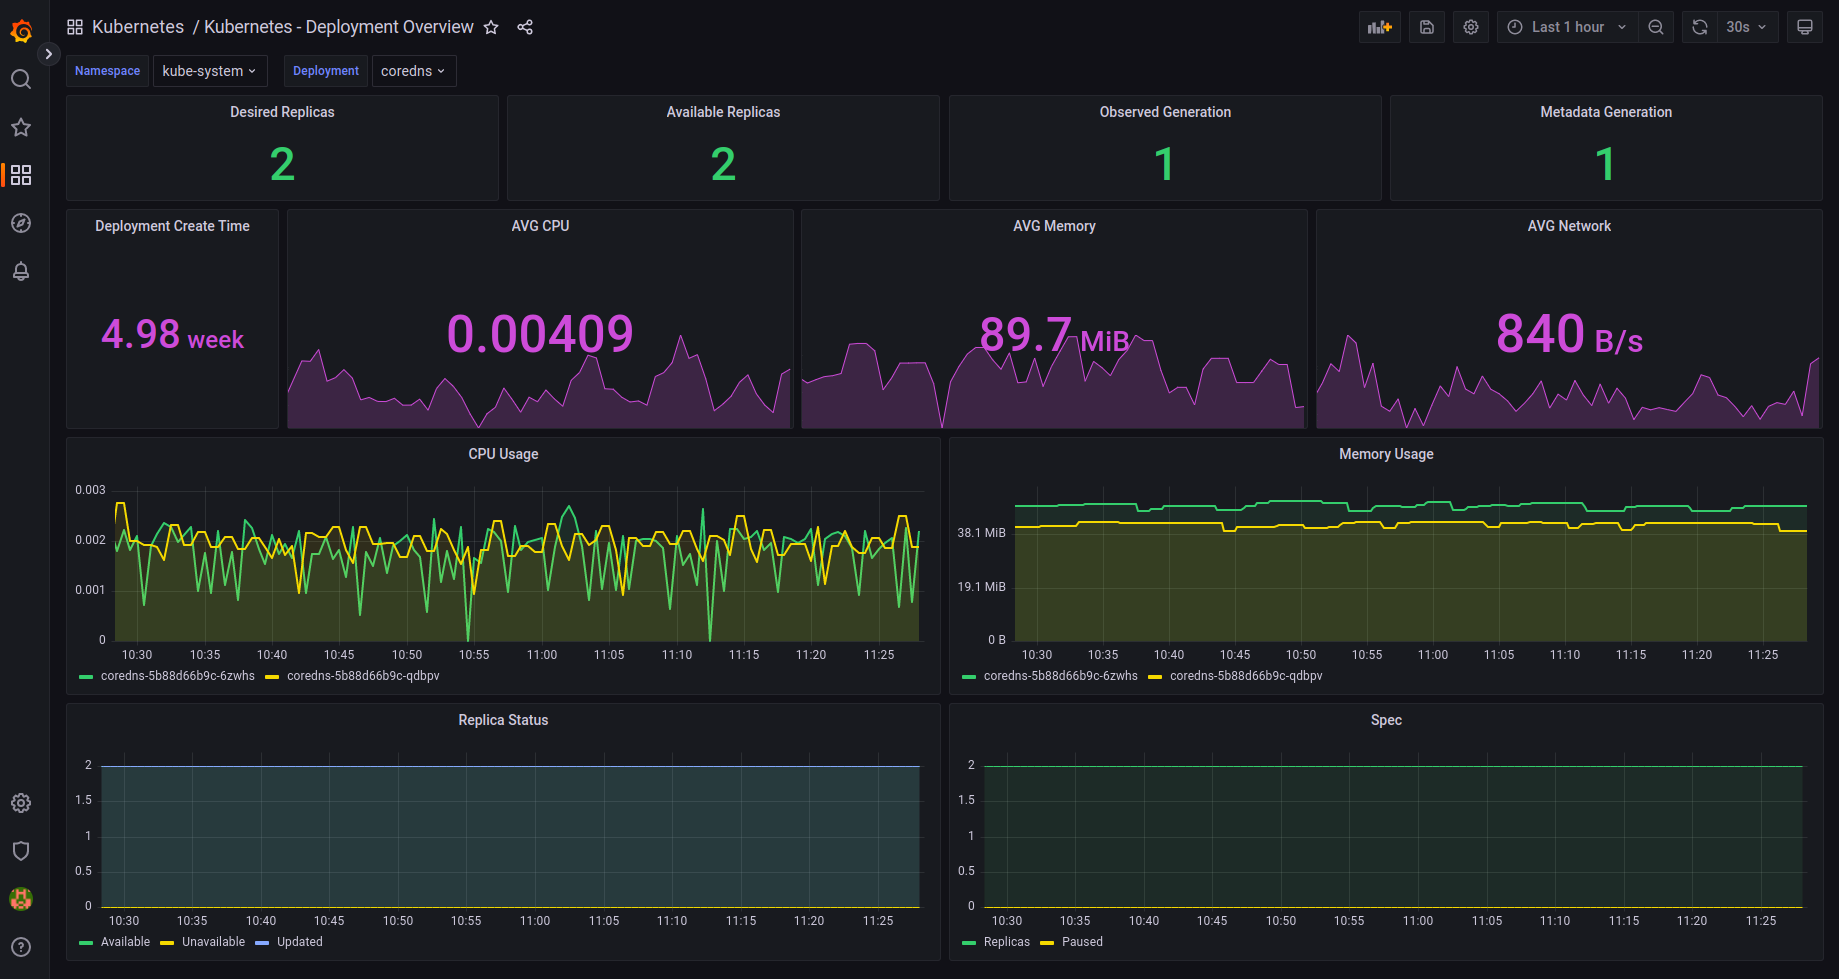
Import Kubernetes Deployment Overview Dashboard
Follow the instructions below to create a grafana dashboard to monitor the kubernetes cluster:
- Click on Dashboards on left panel and click
+ Import - Enter 17685 to import the dashboard
- Click Load
- Enter
Kubernetes - Deployment Overviewas the Dashboard name - Enter
Kubernetesas the folder name. It will create the folder if it doesn't exist. - Select
Prometheusas the endpoint under prometheus data sources drop down - Click
Import - Save the dashboard by clicking the
Save dashboardicon on the top right corner
This will dispaly an overview of the kubernetes deployments in the cluster. The dashboard should look something like this:
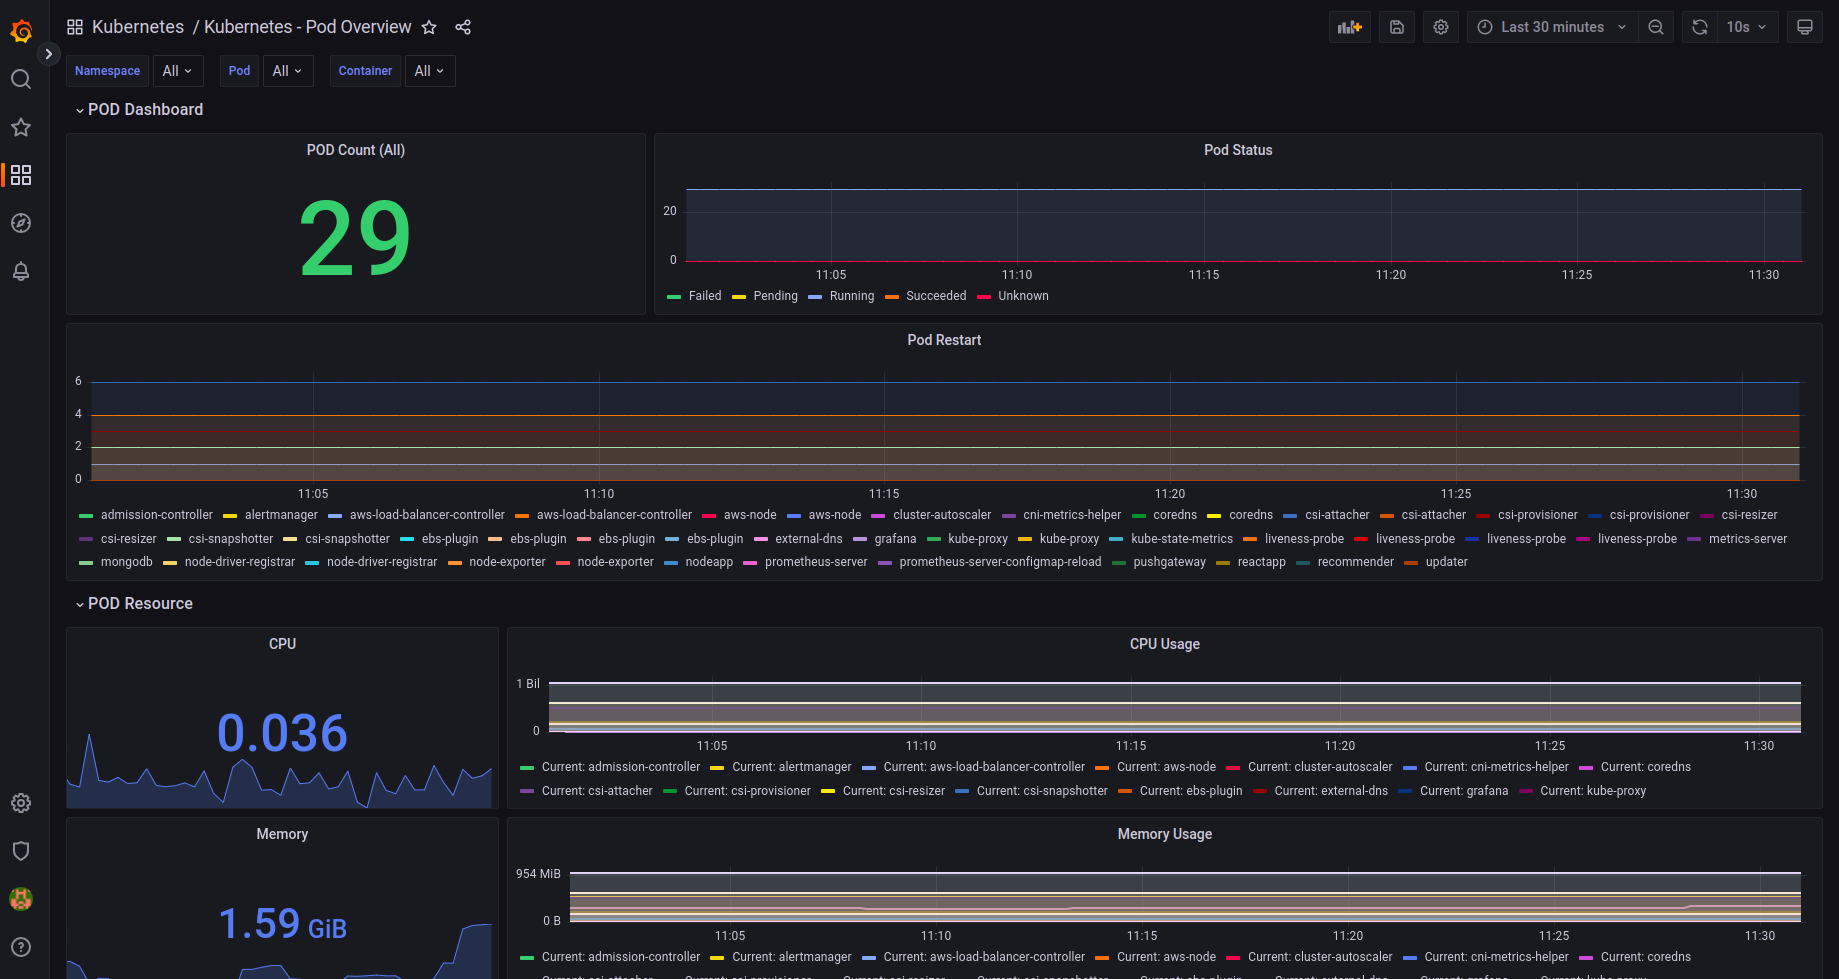
Import Kubernetes Pod Overview Dashboard
Follow the instructions below to create a grafana dashboard to monitor the kubernetes pods:
- Click on Dashboards on left panel and click
+ Import - Enter 17684 to import the dashboard
- Click Load
- Enter
Kubernetes - Pod Overviewas the Dashboard name - Enter
Kubernetesas the folder name. It will create the folder if it doesn't exist. - Select
Prometheusas the endpoint under prometheus data sources drop down - Click
Import - Save the dashboard by clicking the
Save dashboardicon on the top right corner
This will dispaly an overview of the kubernetes pods in the cluster. The dashboard should look something like this:
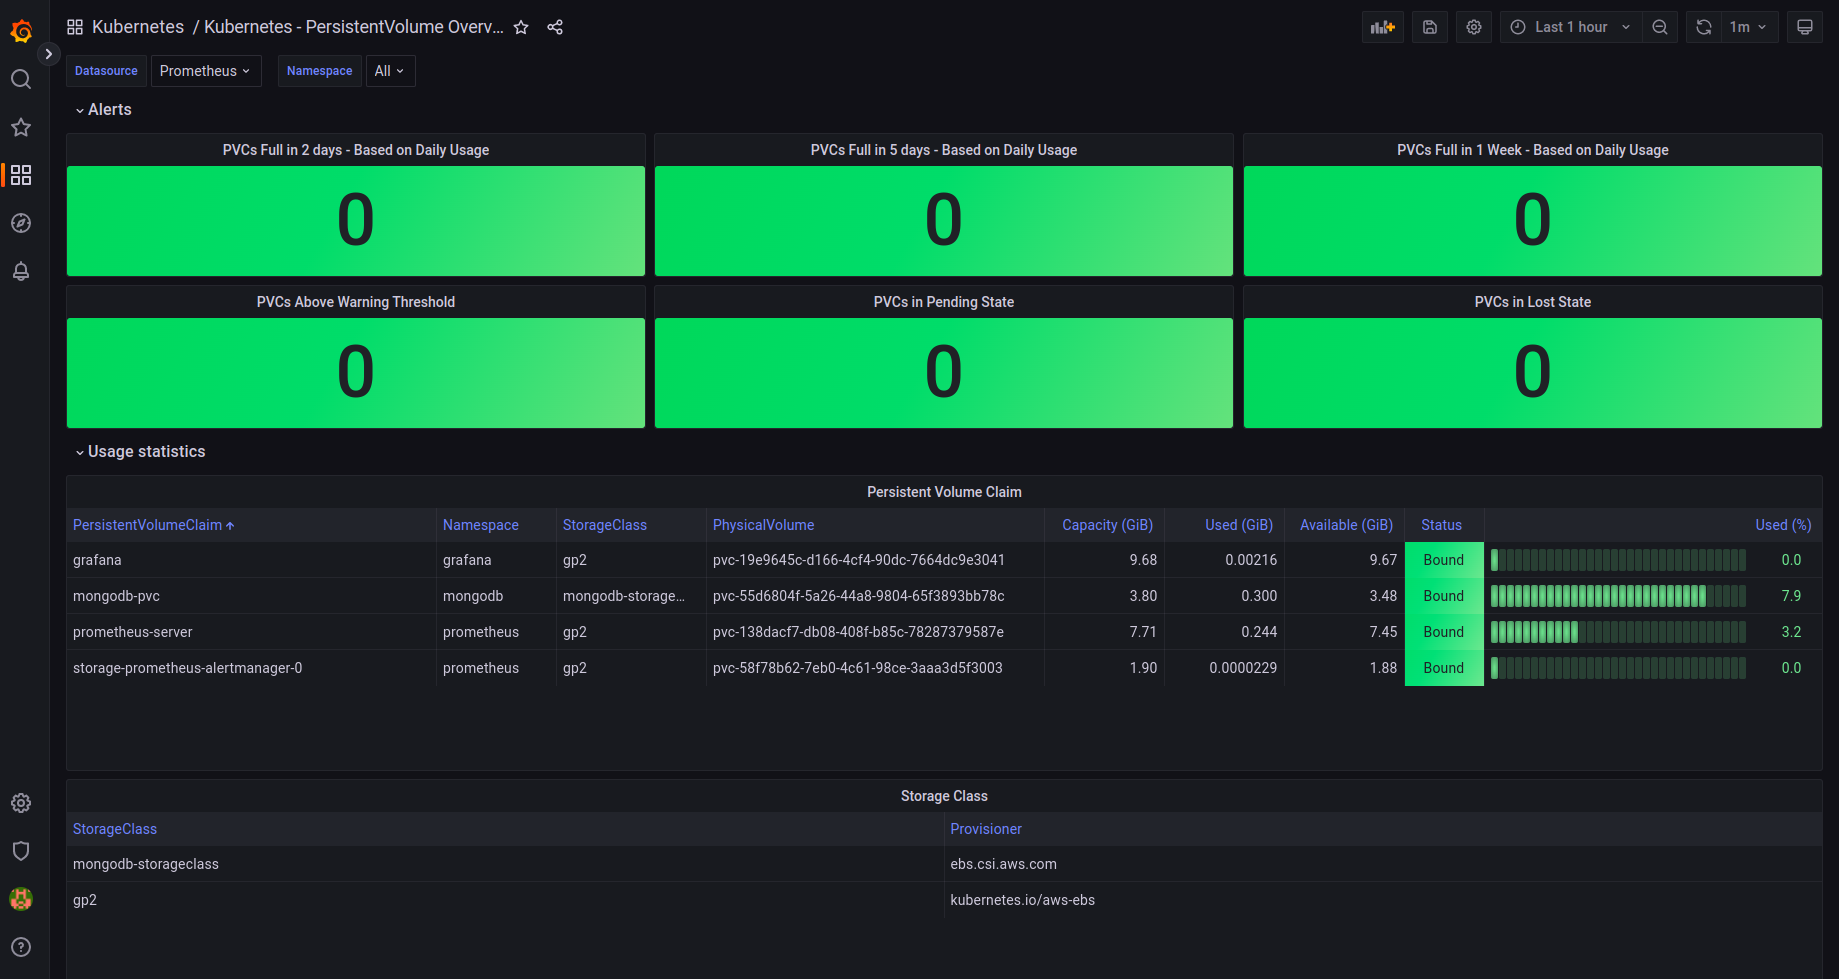
Import Kubernetes PersistentVolume Overview Dashboard
Follow the instructions below to create a grafana dashboard to monitor the kubernetes persistent volumes:
- Click on Dashboards on left panel and click
+ Import - Enter 17682 to import the dashboard
- Click Load
- Enter
Kubernetes - PersistentVolume Overviewas the Dashboard name - Enter
Kubernetesas the folder name. It will create the folder if it doesn't exist. - Select
Prometheusas the endpoint under prometheus data sources drop down - Click
Import - Save the dashboard by clicking the
Save dashboardicon on the top right corner
This will dispaly an overview of the kubernetes persistent volumes in the cluster. The dashboard should look something like this:
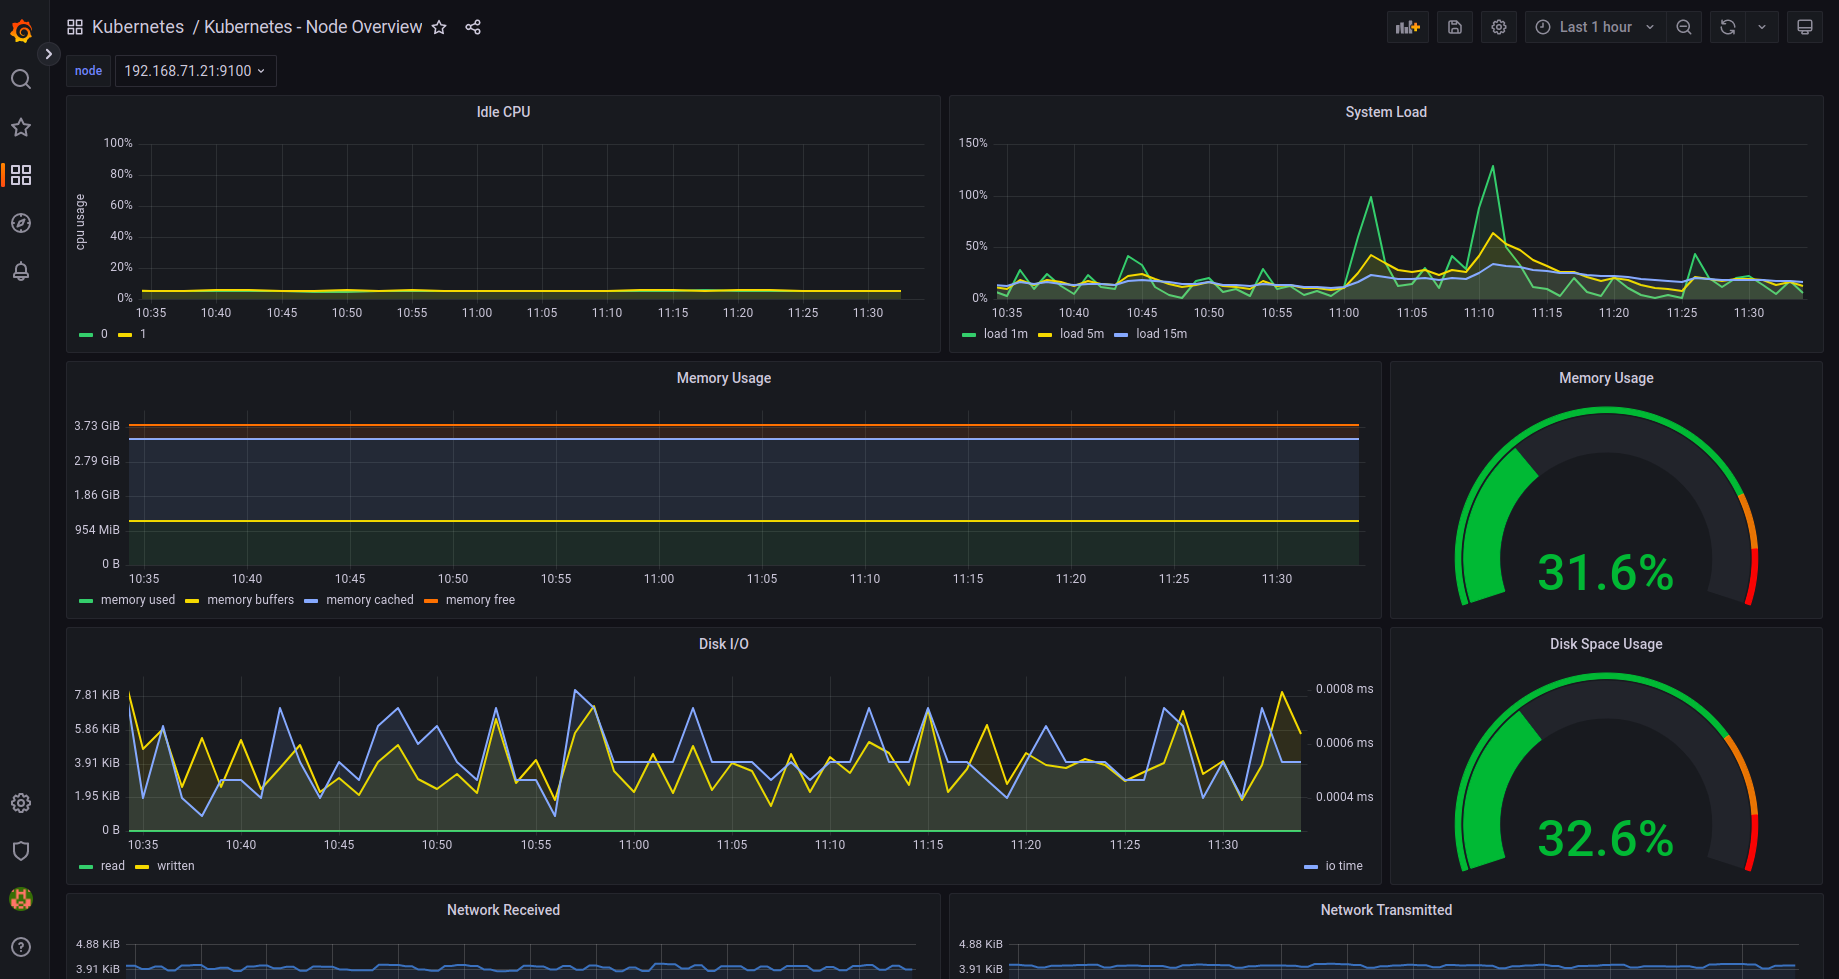
Import Kubernetes Node Overview Dashboard
Follow the instructions below to create a grafana dashboard to monitor the kubernetes nodes:
- Click on Dashboards on left panel and click
+ Import - Enter 17683 to import the dashboard
- Click Load
- Enter
Kubernetes - Node Overviewas the Dashboard name - Enter
Kubernetesas the folder name. It will create the folder if it doesn't exist. - Select
Prometheusas the endpoint under prometheus data sources drop down - Click
Import - Save the dashboard by clicking the
Save dashboardicon on the top right corner
This will dispaly an overview of the kubernetes nodes in the cluster. The dashboard should look something like this: