Istio Metrics and Monitoring
Proxies that are running as sidecar containers in our application exposes rich telemetry about all the network traffic between these services.
We can visualize these metrics using Prometheus, Grafana, Kiali, and Jaegar. Istio provide these tools as addons and can be simply installed using the following command:
Since we already have Prometheus and Grafana installed in our cluster, we are going to use that and not install it via Istio.
Note
If you don't already have prometheus and grafana installed in your cluster, you can install them from istio addons as follows:
# Install grafana istio addon
kubectl apply -f samples/addons/prometheus.yaml

# Install grafana istio addon
kubectl apply -f samples/addons/grafana.yaml
This will have the required dashboards pre-installed. You don't need to import them as we had to do in our existing grafana deployment.
Step 1: Update Prometheus
In order for prometheus to pick istio metrics correctly, we need to make a small change to our prometheus deployment.
Edit prometheus-server configmap as follows:
# Set kubectl editor to nano
export KUBE_EDITOR=nano

# Edit the configmap
kubectl edit configmap prometheus-server -n prometheus
Make the following changes in prometheus.yml section:
- Replace all occurances of
(.+?)(?::\d+)?;(\d+)with([^:]+)(?::\d+)?;(\d+) - Change the
scrape_intervalto15s
Now, restart the prometheus-server deployment:
Verify if the pods are running without error:
Step 2: Import Istio Dashboards in Grafana
Next, let's import Istio dashboards in our Grafana deployment. We'll use a script to that.
Make sure to replace the values of GRAFANA_HOST and GRAFANA_CRED variables with the values specific to your Grafana set up.
Now, run the script to import dashboards to your Grafana:
# Give execute permission to the script
chmod +x import-istio-grafana-dashboards.sh

# Execute the script
./import-istio-grafana-dashboards.sh
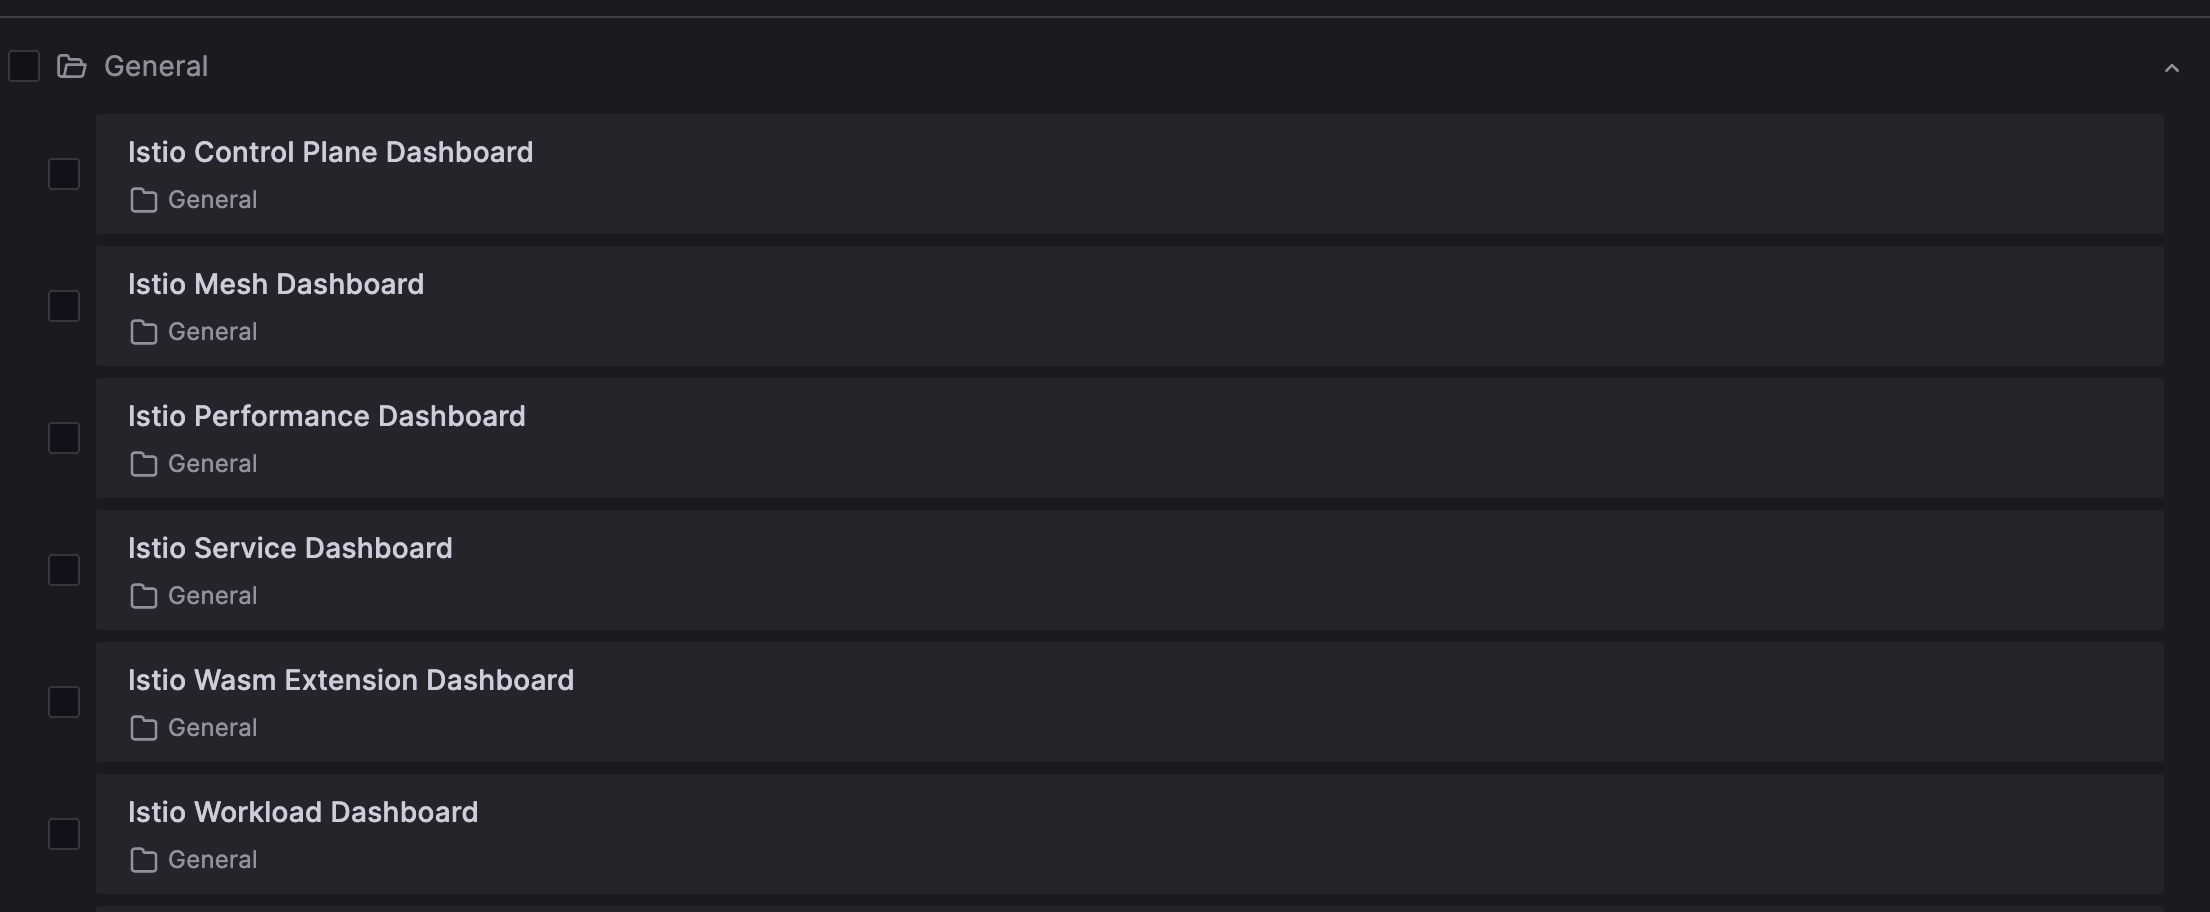
Go to Grafana console and verify if Istio related dashboards were imported successfully.
Step 3: Generate Traffic to Gather Istio Metrics
Let's generate traffic for our book management microservices to gather sufficient Istio metrics that we can visualize in Grafana. We'll use selenium to simulate and generate traffic.
First, create a python script as follows:
Next, create a virtual environment and install selenium using pip3:
# Create virtual environment
virtualenv venv

# Activate virtual environment
source venv/bin/activate

# Install selenium
pip3 install selenium
Now, run the traffic generator:
Now, head to Grafana and check the Istio dashboards to confirm if you can view Istio metrics.
References: